Abstract
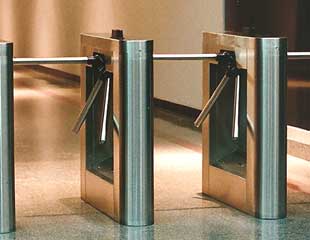
MTA (Subway operator of NYC) provides passenger flow data based on the record of each turnstile. Wait, what is a turnstile? It’s something like this:
 |
|---|
| Fig 1. Turnstiles, source: http://www.turnstile.com/ |
Imagine that each station has tens of turnstiles and each line has tens of stations, isn’t it hard to harness these data for analysis? Don’t be panic, in this notebook, we will go through the following items:
- Read MTA turnstile data
- Find turnstile data by line name (or it can be easily tailored to station names)
- Calculate entries and exits for each station
- Visualize daily entry/exit dynamics for your chosen stations
Read MTA Turnstile Data
import pandas as pd
import numpy as np
import matplotlib.pyplot as plt
import seaborn as sb
from collections import defaultdict
pd.options.display.float_format = '{:.2f}'.format
%matplotlib inline
# 1 sample week.
# MTA uses the data on each Saturday, e.g 10/05/2019, to name their data file.
week = 191005
# url of data source
url = 'http://web.mta.info/developers/data/nyct/turnstile/turnstile_{}.txt'
df_sample = pd.read_csv(url.format(week))
df_sample.head()| C/A | STATION | LINENAME | DATE | TIME | ENTRIES | EXITS | |
|---|---|---|---|---|---|---|---|
| 0 | A002 | 59 ST | NQR456W | 09/28/2019 | 00:00:00 | 7215740 | 2444319 |
| 1 | A002 | 59 ST | NQR456W | 09/28/2019 | 04:00:00 | 7215766 | 2444322 |
| 2 | A002 | 59 ST | NQR456W | 09/28/2019 | 08:00:00 | 7215788 | 2444357 |
| 3 | A002 | 59 ST | NQR456W | 09/28/2019 | 12:00:00 | 7215862 | 2444436 |
| 4 | A002 | 59 ST | NQR456W | 09/28/2019 | 16:00:00 | 7216108 | 2444474 |
Each row in the records represents one turnstile in a station. The “ENTRIES” and “EXITS” column are count of total entries and exits since this turnstile is installed. They are provided on a 4-hour per record basis. Given this way, for example, if we want to calculate how many entries happen within a day, we can use today’s record at midnight to minus the record at midnight of the previous day. A comprehensive explaination could be found on MTA’s website.
Find Turnstile Data by Line Name
Alright, let’s start with a simple application: Find out how many entries happen in each A line station at the weeks of 10/05/2019, 10/12/2019, and 10/19/2019.
weeks = [191005, 191012, 191019]
lines = ['A'] # we write code capable of handling multiple lines
df_list = []

for week in weeks:
    df_temp = pd.read_csv(url.format(week))
    ind = (df_temp['UNIT'] == None)
    print('week: ', week) # print out weeks to know how far we have gone
    for line in lines:
        ind = (ind | df_temp['LINENAME'].str.contains(line))
        print('  line: ', line) # also print out lines to know how far we have gone
    df_list.append(df_temp.loc[ind])

mta_df = pd.concat(df_list)
mta_df.sort_values(by = ['STATION'], inplace = True) # group by station name
mta_df.head()| C/A | STATION | LINENAME | DATE | TIME | ENTRIES | EXITS | |
|---|---|---|---|---|---|---|---|
| 70148 | N137 | 104 ST | A | 10/15/2019 | 20:00:00 | 1681115231 | 978345287 |
| 69605 | N137 | 104 ST | A | 10/04/2019 | 08:00:00 | 301455 | 191435 |
| 69604 | N137 | 104 ST | A | 10/04/2019 | 04:00:00 | 301164 | 191418 |
| 69603 | N137 | 104 ST | A | 10/04/2019 | 00:00:00 | 301155 | 191403 |
| 69602 | N137 | 104 ST | A | 10/03/2019 | 20:00:00 | 301130 | 191322 |
Since data is recorded each 4 hours, we want to collapse them into a one-day level, i.e. merge same day records to one record.
# This section calculates No. of Entries and Exits...
# for each turnstile at a same-day level
temp_d = defaultdict(list) # for Entries
temp_d1 = defaultdict(list) # for Exits
turnstile_d = {}
turnstile_d1 = {}

# Collapse data to a same-day level
for row in mta_df.itertuples():
    C_A, unit, scp, station, linename, date =\
	row[1], row[2], row[3], row[4], ''.join(sorted(row[5])), row[7]
    entries = row[10]
    exits = row[11]
	# Create a unique key for each turnstile at each day
    k = (C_A, unit, scp, station, linename, date)
	# Record entries and exits of each record at the same day
    temp_d[k].append(entries)
    temp_d1[k].append(exits)

for key, value in temp_d.items():
    entry = abs(max(value) - min(value)) # (max - min) of a day
    turnstile_d[key] = [entry]
for key, value in temp_d1.items():
    exit = abs(max(value) - min(value)) # (max - min) of a day
    turnstile_d1[key] = [exit]

# form dataframes from dictionaries
dict_df = pd.DataFrame.from_dict(turnstile_d, orient='index')
dict_df.rename(columns = {0:'Entries'}, inplace=True)
dict_df1 = pd.DataFrame.from_dict(turnstile_d1, orient='index')
dict_df1.rename(columns = {0:'Exits'}, inplace=True)

dict_df['Exits'] = dict_df1['Exits']

# take a look of what we obtain
dict_df.head()| Entries | Exits | |
|---|---|---|
| (N137, R354, 00-06-01, 104 ST, A, 10/15/2019) | 289 | 11 |
| (N137, R354, 00-00-00, 104 ST, A, 10/04/2019) | 689 | 269 |
| (N137, R354, 00-00-00, 104 ST, A, 10/03/2019) | 685 | 379 |
| (N137, R354, 00-00-00, 104 ST, A, 10/02/2019) | 720 | 352 |
| (N137, R354, 00-00-00, 104 ST, A, 10/01/2019) | 603 | 352 |
| ... | ... | ... |
| (N094, R029, 01-03-04, WORLD TRADE CTR, 23ACE, 10/07/2019) | 529 | 214 |
| (N094, R029, 01-03-04, WORLD TRADE CTR, 23ACE, 10/08/2019) | 572 | 196 |
| (N094, R029, 01-03-03, WORLD TRADE CTR, 23ACE, 10/09/2019) | 430 | 372 |
| (N094, R029, 01-03-03, WORLD TRADE CTR, 23ACE, 10/10/2019) | 446 | 493 |
| (N094, R029, 01-03-03, WORLD TRADE CTR, 23ACE, 10/11/2019) | 493 | 465 |
We just collasped the index column for statistical purpose, now let’s expand it again.
# convert back to original format
turnstile_df = pd.DataFrame(columns=[])
turnstile_df['CA'] = [row[0][0] for row in dict_df.itertuples()]
turnstile_df['unit'] = [row[0][1] for row in dict_df.itertuples()]
turnstile_df['scp'] = [row[0][2] for row in dict_df.itertuples()]
turnstile_df['station'] = [row[0][3] for row in dict_df.itertuples()]
turnstile_df['linename'] = [row[0][4] for row in dict_df.itertuples()]
turnstile_df['date'] = [row[0][5] for row in dict_df.itertuples()]
turnstile_df['entries'] = [row[1] for row in dict_df.itertuples()]
turnstile_df['exits'] = [row[2] for row in dict_df.itertuples()]
turnstile_df.head()| CA | unit | scp | station | linename | date | entries | exits | |
|---|---|---|---|---|---|---|---|---|
| 0 | N137 | R354 | 00-06-01 | 104 ST | A | 10/15/2019 | 289 | 11 |
| 1 | N137 | R354 | 00-00-00 | 104 ST | A | 10/04/2019 | 689 | 269 |
| 2 | N137 | R354 | 00-00-00 | 104 ST | A | 10/03/2019 | 685 | 379 |
| 3 | N137 | R354 | 00-00-00 | 104 ST | A | 10/02/2019 | 720 | 352 |
| 4 | N137 | R354 | 00-00-00 | 104 ST | A | 10/01/2019 | 603 | 352 |
Then, let’s arrange the dataframe in another way:
# sum up entries at each station, use 'station' as columns and 'date' as index
tstile = pd.pivot_table(turnstile_df, values='entries',\
 index=['date'], columns=['station'], aggfunc=np.sum)
tstile.head()| station | 104 ST | 111 ST | 125 ST | 14 ST | 145 ST | 168 ST | ... | W 4 ST-WASH SQ | WORLD TRADE CTR |
|---|---|---|---|---|---|---|---|---|---|
| date | |||||||||
| 09/28/2019 | 0 | 1 | 17522 | 11118 | 14909 | 9626 | ... | 28372 | 450 |
| 09/29/2019 | 0 | 0 | 14850 | 8301 | 12179 | 6601 | ... | 23094 | 741 |
| 09/30/2019 | 1569 | 2227 | 22058 | 17018 | 18440 | 16861 | ... | 31745 | 16174 |
| 10/01/2019 | 1613 | 2438 | 23991 | 18127 | 19394 | 18269 | ... | 35842 | 17173 |
| 10/02/2019 | 2029 | 2929 | 27774 | 21693 | 24183 | 20073 | ... | 37851 | 18381 |
It is well know that the source data could be problematic because of faulty turnstiles. So, before doing any analysis, we want to check if the data is valid. One method is to look at the average weekly entries for each station.
checker = tstile.sum()/len(weeks)
checker.sort_values(ascending = False)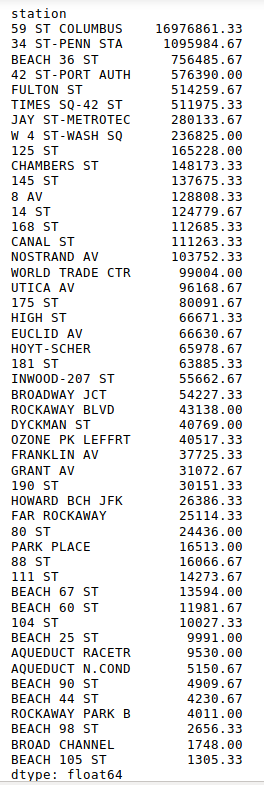
From the above table, we can see that 59 ST COLUMBUS station has more than 16 million entries each week, but Penn Station (34 ST-PENN STA, one of the transportation centers of NYC) has only roughly 1 million. There must be some faulty turnstiles at 59 ST COLUMBUS station. Let’s remove 59 ST COLUMBUS to avoid misleading results. If interested, one can find that it was the turnstile with SCP number ‘01-05-01’ encountered problem from 0:00-8:00 AM on 09/28/2019. We are supposed to remove thoes faulty records and calculate for 59 ST COLUMBUS station again, but for simplicity, we just remove this station.
Let’s plot the results.
tstile.drop(columns=['59 ST COLUMBUS'], inplace = True)
tstile_weekly = tstile.sum()/len(weeks)
tstile_weekly.sort_values(ascending=False, inplace=True)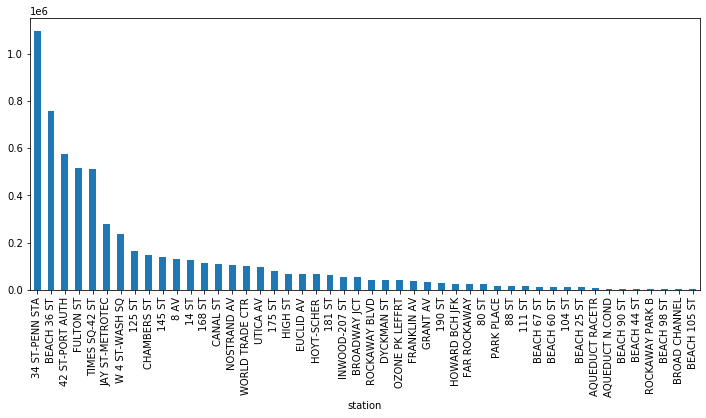 |
|---|
| Fig 1. Ranking of entries - Stations on A line |
Not surprising, those well known places, like Penn Station, Port Authority, Fulton Street (under World Trade Center), and Time Square rank on the top. However, we also notice BEACH 36 ST station, which is the terminal station and locates at far south Brooklyn, ranks in the 2nd place. This seems a little weired. If you are interested, you can further check this station like what we did for 59 ST COLUMBUS.
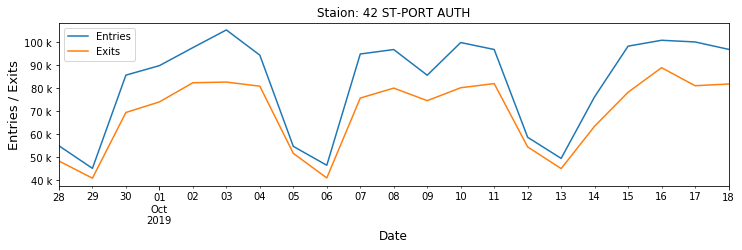
Visualize Daily Entry/Exit Dynamics for Chosen Stations
Now, we already have the weekly ranking, but what if we want to know intra-week dynamics of entries/exits? Let’s say, for Penn Station, Port Authority, and Time Square.
stations = ['34 ST-PENN STA', '42 ST-PORT AUTH', 'TIMES SQ-42 ST']

# Convert date string to datetime object for plot
turnstile_df['date'] = pd.to_datetime(turnstile_df['date'])
tstile_dynamic = turnstile_df.groupby(['station','date']).sum().\
sort_values(by=['station', 'date'],ascending=False)
tstile_dynamic.reset_index(inplace=True)
tstile_dynamic.set_index('date', inplace = True)
tstile_dynamic.sort_index(ascending=True, inplace = True)

legend = ['Entries', 'Exits']

# Define a function for better view of y sticks
def y_fmt(tick_val, pos):
    if tick_val > 1000000:
        val = int(tick_val)/1000000
        return '{:.0f} M'.format(val)
    elif tick_val > 1000:
        val = int(tick_val) / 1000
        return '{:.0f} k'.format(val)
    else:
        return tick_val

for station in stations:
    f, ax = plt.subplots(figsize = (15,3))
    tstile_dynamic[tstile_dynamic['station'] == station].plot(ax = ax, y = 'entries')
    tstile_dynamic[tstile_dynamic['station'] == station].plot(ax = ax, y = 'exits')
    ax.legend(legend)
    ax.set_xlabel('Date',size = 12)
    ax.set_ylabel('Entries/Exits',size = 15)
    ax.set_title('Staion: ' + station)
ax.yaxis.set_major_formatter(tick.FuncFormatter(y_fmt))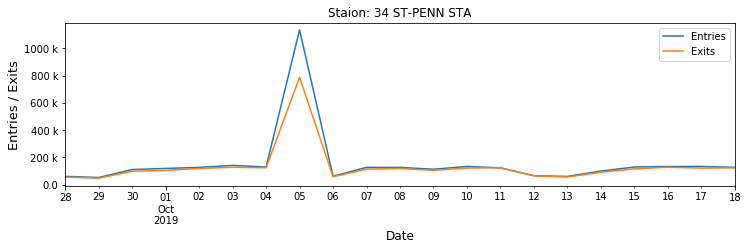 |
|---|
 |
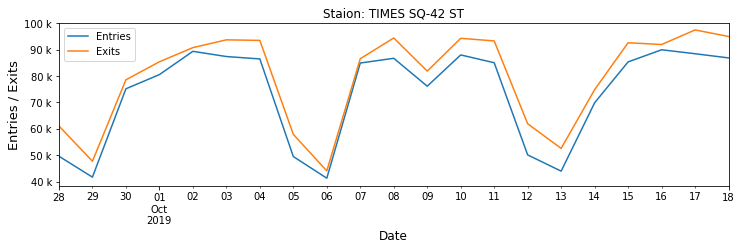 |
| Fig 2. Weekly dynamics of entries/exits at several busy NYC stations |
What happens at Penn Station on 10/05? Another turnstile problem? A big event (what event can boost the entries/exits by more than 800k)? It is subjected to be checked.
Closing Notes
Unlike other datasets, MTA turnstile data is provided in .txt format, so we need to use extra code snippets to handle it. Also remember that turnstile data can be misleading due to frequent malfunction of turnstiles. Make sure to check if the data makes sense before going any further.
Acknowledgement: the part on calculating entries per day was forked from https://github.com/ZachHeick/MTA_Data_Analysis.